Financial Uncertainty
Farm income declined rapidly in the 1990s due to the Bovine spongiform encephalopathy (BSE) outbreak. Total farm income did recover to a high of £5.8m and has remained stable ever since. Despite this, between 2017 and 2018, total farming income fell by 17 per cent to £4.7bn and 14 per cent of farms made no profit. The chart below (Defra) shows farm income until 2018.

Between 2017-18 and 2019-20, the average profit for farms was £48,800 and subsidy payments made up an average of 53% of this figure. In 2020-21, the average Farm Business Income (FBI) across all UK farm types was £46,500 (at current prices) compared to £39,000 in 2019-20. 16% of UK farms failed to make an income in 2019-20 and 72% of farms made less than £50,000. In 2020, upland farmers received an average income of just £22,800 and total farm income nationally was £4.2m.1Defra.2022. Agriculture in the United Kingdom. https://assets.publishing.service.gov.uk/government/uploads/system/uploads/attachment_data/file/1094493/Agriculture-in-the-UK-27jul22.pdf
The following chart for last year shows that most farms make less than £50,000 and a third of farms in the UK make less than £20,000. Net farm income is a narrower measure of income as it deducts rent on land and unpaid labour.3Defra.2022. Agriculture in the United Kingdom. https://assets.publishing.service.gov.uk/government/uploads/system/uploads/attachment_data/file/1094493/Agriculture-in-the-UK-27jul22.pdf

Farming income by type
Between 2017-18 and 2019-20, only 20 per cent of all farms made a profit of more than £75,000. Of that 20 per cent, the greatest proportion was dairy, pigs and general cropping. Mixed and grazing animal farms were more likely to make a loss.5Defra. 2022. Agriculture in the UK Evidence Pack. https://assets.publishing.service.gov.uk/government/uploads/system/uploads/attachment_data/file/1106562/AUK_Evidence_Pack_2021_Sept22.pdf

You can see from the above graph that even though dairy is profitable (more than 51 per cent made more than £75,000), seven per cent made a loss. Some 69 per cent of grazing livestock farms in the Less Favoured Areas and almost 76 per cent of lowland grazing. Livestock farms made a profit of less than £25,000 per year while 19 per cent of poultry farms made a profit of over £75,000 but over 20 per cent made less than £10,000.
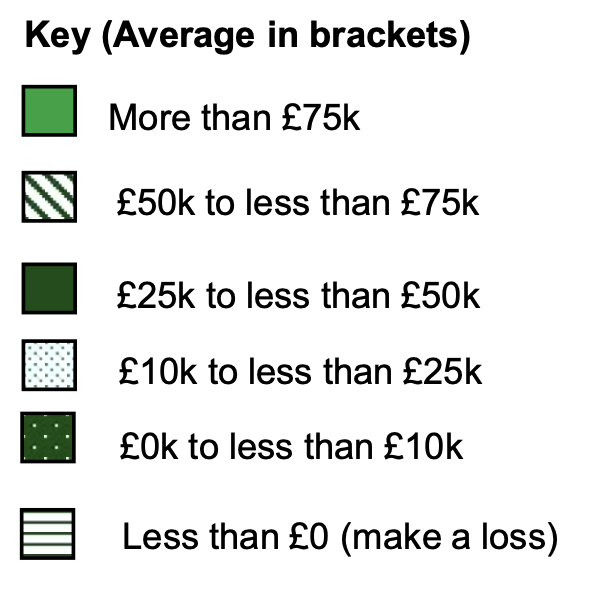
The Defra chart below shows farm business income for last year for each type of farm.7Defra.2022. Agriculture in the United Kingdom. https://assets.publishing.service.gov.uk/government/uploads/system/uploads/attachment_data/file/1094493/Agriculture-in-the-UK-27jul22.pdf

Although output is rising, this is offset by the increasing costs of feed and fertiliser. Based on performance, 52 per cent of farms failed to recover their costs last year.
Cereal farming income is forecasted to rise by 51 per cent this year due to higher output, with general cropping rising by 70 per cent for the same reason. Dairy farm income is expected to rise 21 per cent as a drop in production brings higher farmgate prices. Lowland grazing animal farms will only see a three per cent rise along with Less Favoured Area upland areas which will see a rise of only one per cent.
Forecasts for the pig and chicken industries are much worse. In England, output on specialist pig farms is expected to fall by three-quarters because of increased feed costs and abattoir and supply chain problems. Poultry farm income will drop by 51 per cent for the same reasons.8Defra.2022. Agriculture in the United Kingdom. https://assets.publishing.service.gov.uk/government/uploads/system/uploads/attachment_data/file/1094493/Agriculture-in-the-UK-27jul22.pdf
It is important to bear in mind that these Defra figures are based on small sample sizes and the averages can be skewed by larger incomes on bigger farms. Even Defra warns that averages mask variation in profitability. Net farm income shows us a large percentage of farms are not breaking even. The average income also needs to be shared by all who do unpaid work on the farm, so the amount is likely to provide a salary for more than just one person as farms are often family run.